5 Critical Warning Signs the Everything Rally Is Ending (And How to Prepare Your Portfolio Now)
For months, perhaps even years, investors have enjoyed a rare and exhilarating market phenomenon: the “Everything Rally.” Stocks, bonds, real estate, and even cryptocurrencies have all seemed to move in one direction—up. It feels like a golden age of investing where every decision is the right one. But as seasoned investors know, no party lasts forever. The quiet question in the back of everyone’s mind is growing louder: when does the music stop?
Predicting the exact top of a market is a fool’s errand. However, recognizing the signs of a seasonal change in the economic weather is not. There are reliable, data-driven indicators that have historically served as early warning systems for market downturns. This article is not about panic. It is about preparation. We will dissect five critical warning signs that suggest the Everything Rally is losing steam and, most importantly, discuss how you can begin to prepare your portfolio for the inevitable shift.
First, what is an ‘Everything Rally’?
Before we look for the end, let’s define the term. An ‘Everything Rally’ describes a period where massive liquidity and low interest rates, typically from central banks like the Federal Reserve, push the prices of nearly all asset classes upward simultaneously. It’s a tide that lifts all boats, driven more by the sheer volume of money seeking a return than by the underlying fundamental strengths of individual assets.
1. The Oracle of the Bond Market: Yield Curve Inversion
If the market has an oracle, it resides in the bond market. The yield curve, specifically the spread between the 10-year and 2-year U.S. Treasury yields, is arguably the most powerful recession predictor we have. In a healthy economy, you’d expect a higher interest rate for lending money over a longer period. An inverted yield curve is when this flips—short-term rates become higher than long-term rates.
Think of it this way: if you were to lend money to a friend, you’d demand a much higher interest rate for a 10-year loan than for a 2-year loan, because the risk is higher over a longer period. When the market starts demanding more compensation for the short-term, it’s screaming that it sees immediate danger ahead, even more so than the long-term risks. An inversion has preceded every major U.S. recession in the past 50 years. It’s a signal to be taken with the utmost seriousness.
2. The Market’s Fever Chart: A Sustained Rise in the VIX
The CBOE Volatility Index, or VIX, is often called the market’s “fear gauge.” It measures the expected volatility of the S&P 500 over the next 30 days. A low VIX (typically below 20) suggests complacency and low anxiety among investors. A high VIX suggests fear and uncertainty are on the rise.
A single-day spike in the VIX can be dismissed as noise. However, a sustained rise, where the VIX establishes a new, higher floor (e.g., consistently trading above 25 or 30), is a critical warning sign. It’s the market equivalent of a rising fever. It indicates that investors are increasingly paying a premium for options to protect their portfolios against a potential downturn. When the cost of insurance goes up and stays up, it’s because the perceived risk of a crash is becoming the consensus view.
3. The Central Bankers’ Pivot: From ‘Accommodative’ to ‘Hawkish’
Central banks, especially the U.S. Federal Reserve, are the architects of the environment that creates an Everything Rally. Their policies of low interest rates (accommodative policy) and quantitative easing are the fuel. Therefore, one of the most important signs to watch is a change in their tone and policy direction.
Listen carefully to the language used by the Fed Chair and its governors. Are words like “patient” and “supportive” being replaced by “vigilant” and “forceful” in the context of fighting inflation? This linguistic shift, known as a “hawkish pivot,” is the first step. It is inevitably followed by concrete actions: raising interest rates and reducing the central bank’s balance sheet (quantitative tightening). This directly removes liquidity from the system, acting as a brake on the very engine that powered the rally.
4. The Engine Room Falters: Widespread Declining Corporate Earnings
While liquidity can inflate asset prices in the short term, the long-term value of stocks is anchored to corporate earnings. During an Everything Rally, investors often forgive mediocre earnings, focusing instead on future growth stories. This spell breaks when earnings across multiple sectors begin to consistently miss expectations.
Pay attention during earnings season. Are companies that were once market darlings now issuing cautious forward guidance? Are bellwether companies in key sectors like technology, finance, and consumer goods reporting not just a slowdown in growth, but actual declines in profits? Widespread earnings erosion is a fundamental red flag that the economic reality can no longer support the market’s optimistic valuations.
5. The Credit Squeeze: Tightening Financial Conditions
This is a more technical, but critically important, indicator. “Financial conditions” refers to how easily businesses and consumers can access credit. When conditions are loose, money is cheap and easy to borrow, fueling spending and investment. When they tighten, the opposite happens.
Central bank rate hikes are one part of this, but it goes further. Watch for signs that banks are becoming more reluctant to lend, that corporate bond yields are rising sharply (making it more expensive for companies to raise capital), and that mortgage rates are climbing. A credit squeeze is a direct constraint on economic growth. If the flow of credit is the economy’s lifeblood, a squeeze is the beginning of a cardiac arrest, and the Everything Rally cannot survive without it.
From Watching to Acting: How to Prepare Your Portfolio Now
Recognizing these signs is the first step. The next is to act methodically, not emotionally. This is not about selling everything and running for the hills. It’s about prudently adjusting your sails for a coming storm.
- Trim High-Beta, High-Flyers: The stocks that soared the highest often fall the hardest. Consider taking some profits from your most speculative, high-growth positions that have benefited most from the low-rate environment.
- Increase Allocation to Defensive Sectors: Begin to rotate capital into sectors that are less sensitive to economic cycles. These include consumer staples (people still buy toothpaste in a recession), healthcare, and utilities. This is a core component of a defensive investment strategy 2025.
- Hold More Cash: Cash is not trash in a downturn. It’s a strategic asset. Holding a higher-than-usual cash position reduces your portfolio’s volatility and provides you with the “dry powder” to buy quality assets at a discount when the market eventually bottoms.
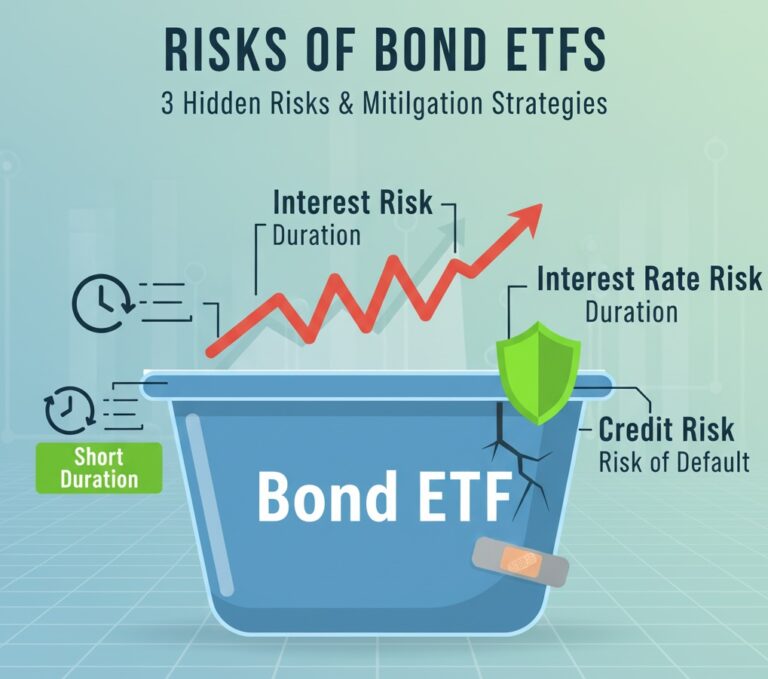
- Review Your Bond Holdings: In a rising rate environment, long-duration bonds can lose value. Ensure your fixed-income allocation is tilted towards shorter-duration, high-quality bonds that are less sensitive to interest rate changes.
Conclusion: The End of an Era, The Start of a Strategy
The end of the Everything Rally will not be a single event but a process. The warning signs discussed here—from the bond market’s prophecy to the Fed’s changing language—are the chapters of that story. By learning to read them, you transform from a passive passenger in a buoyant market to an active navigator of your financial future.
The goal is not to perfectly time the peak. The goal is to have a plan. Seeing the signs clearly allows you to make disciplined, strategic adjustments that will protect your capital and position you to seize the opportunities that will inevitably emerge on the other side of the downturn.
This article is for informational purposes only and should not be considered financial advice.