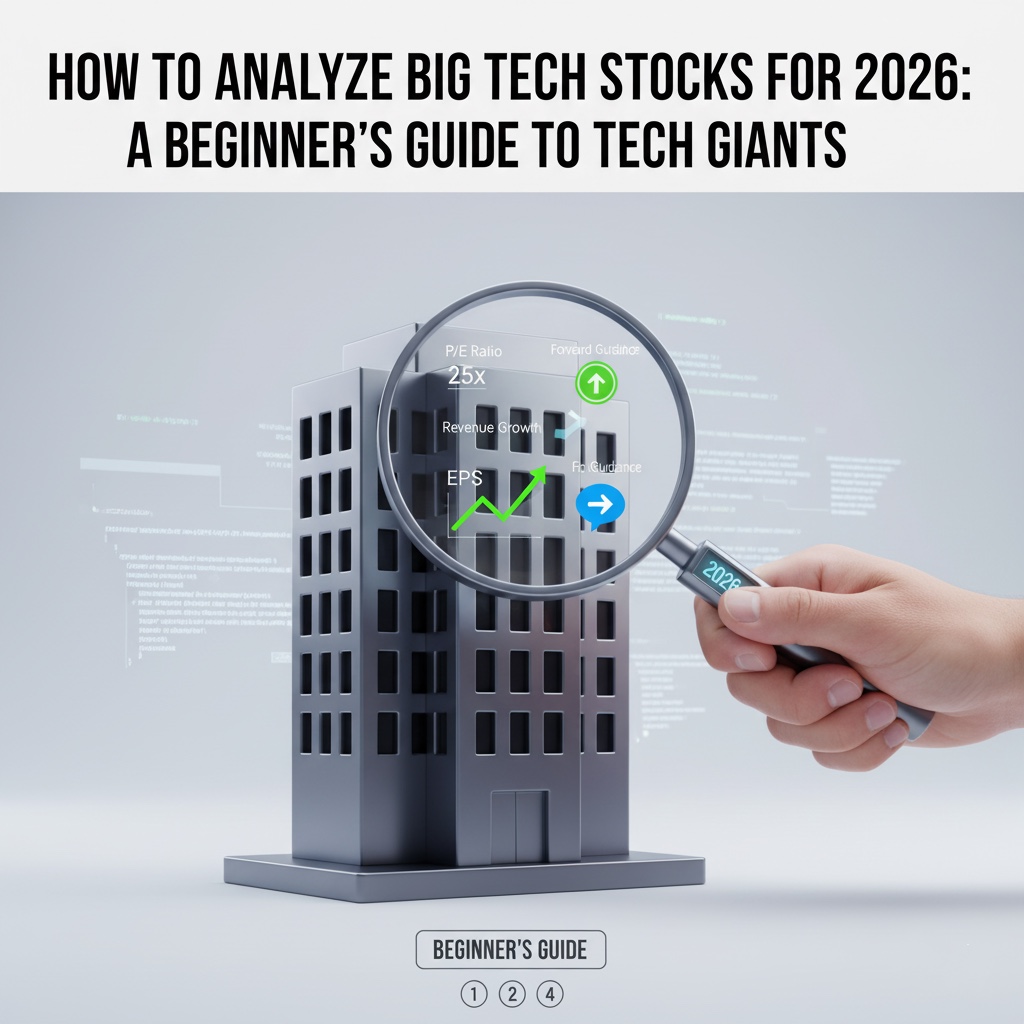
A Beginner’s Guide: How to Analyze Big Tech Stocks for the 2026 Market
You see the headlines every day: tech giants shaping the future, their stocks reaching dizzying new heights. You know you should be a part of that growth, but then you open a financial report and are hit with a wall of acronyms and numbers. It feels less like an investment opportunity and more like an advanced math exam. What if you could cut through that noise with a simple, powerful framework? This guide will equip you with the essential tools to analyze Big Tech stocks for 2026, turning financial jargon into a clear story you can understand and act on.
Beyond the Hype: Why Fundamentals Matter More Than Ever
In a market driven by trends and social media buzz, it’s easy to think of stock picking as a popularity contest. But the enduring value of a company isn’t built on hype; it’s built on performance. Analyzing a stock’s fundamentals is like conducting an inspection before buying a house. You wouldn’t buy a property just because it looks good from the outside; you’d check the foundation, the plumbing, the electrical system. The same principle applies to investing. Understanding the financial health of a company is your foundation for making sound, long-term decisions.
“Price is what you pay. Value is what you get.” – Warren Buffett
This distinction is the heart of smart investing. As we look toward 2026, a year that promises further technological disruption, understanding the real value behind the stock price will be paramount. Let’s break down the four key metrics that will help you do just that.
The ‘Big Four’ Metrics for Your 2026 Analysis Toolkit
To get started, you don’t need a degree in finance. You just need to understand what questions to ask. These four metrics are your essential questions.
1. Price-to-Earnings (P/E) Ratio: The “Price Tag” Metric
What it is: The P/E ratio is the stock’s current price divided by its earnings per share (EPS) over the last 12 months.
Why it matters: It tells you how much you are paying for one dollar of the company’s profit. A high P/E can suggest that a stock is overvalued or that investors expect high future growth. The P/E ratio for tech stocks is often higher than other sectors due to these growth expectations.
Think of it like this: You have two identical houses for sale in the same neighborhood. House A costs $500,000 and generates $25,000 in annual rent. House B costs $600,000 and generates $30,000 in rent. House A has a “P/E” of 20 ($500k / $25k), while House B also has a P/E of 20 ($600k / $30k). But if House C costs $800,000 and only generates $20,000 in rent (a P/E of 40), you’d immediately question if it’s worth the premium price. This is a foundational step in learning how to value a tech company.
2. Revenue Growth: The “Growth Engine” Metric
What it is: The rate at which a company’s sales (revenue) are increasing year-over-year or quarter-over-quarter.
Why it matters: For tech companies, strong revenue growth is a sign of innovation, market demand, and expansion. It shows the company’s products and services are winning in the marketplace.
This is the most straightforward metric. Is the company selling more this year than it did last year? Consistent, strong growth is a powerful indicator of a healthy business. When you hear about a company “beating expectations,” it often refers to stronger-than-anticipated revenue growth.
3. Earnings Per Share (EPS): The “Profitability” Metric
What it is: The company’s total profit divided by the number of outstanding shares.
Why it matters: EPS is a direct measure of a company’s profitability on a per-share basis. If you are a shareholder, this is the portion of the profit pie that belongs to your single share. Growing EPS is a classic sign of a company creating more value for its investors.
This is a core component of the Big Tech financial metrics explained simply. While revenue shows the size of the business, EPS shows how much actual profit it’s generating for its owners.
4. Forward Guidance: The “Crystal Ball” Metric
What it is: The forecast and projections that a company’s own management provides for the upcoming quarters or year.
Why it matters: This is management’s story about the future. It’s one of the most powerful catalysts for stock price movement. Positive guidance can send a stock soaring, while negative guidance can cause a sharp drop, regardless of past performance.
Forward guidance investing is about listening to the captain of the ship. During their quarterly earnings calls, the CEO and CFO will discuss their expectations for revenue, profit margins, and strategic initiatives. As an investor looking at 2026, this is your clearest official signal of where the company believes it is heading. You can find these reports on the “Investor Relations” section of any public company’s website.
Case Study: A Quick Analysis of ‘Company A’ for 2026
Let’s apply this. Imagine we’re looking at a fictional tech giant, “CloudCorp,” in late 2025.
- P/E Ratio: It’s 35, higher than the market average of 25, but in line with its tech peers. This suggests investors are optimistic about its growth.
- Revenue Growth: It posted 20% revenue growth, driven by its AI cloud services division. This is a strong, positive signal.
- EPS: EPS grew by 25%, even faster than revenue. This tells us the company is becoming more profitable and efficient as it scales.
- Forward Guidance: Management guided for “continued strong growth in the cloud segment” and announced a major new AI product launch for mid-2026. This is a very bullish story.
This quick analysis, which took only a few minutes, gives us a powerful narrative. CloudCorp is a profitable, growing company with a confident outlook. This is a much stronger foundation for an investment decision than a news headline alone. A similar exercise can be done for a real-world Apple vs Microsoft stock analysis 2026 comparison.
Conclusion: From Overwhelmed to Empowered
Analyzing Big Tech stocks doesn’t have to be a cryptic puzzle. By focusing on the ‘Big Four’—P/E Ratio, Revenue Growth, EPS, and Forward Guidance—you can build a clear, evidence-based picture of any company’s financial health and future prospects. These metrics are the building blocks of a story that every investor can learn to read.
As you look toward 2026, you now have a toolkit to move beyond the hype. You can ask the right questions, find the answers in the data, and begin your journey not just as a passive observer, but as an informed and confident investor. The story is there in the numbers; you just have to know how to read it.
This article is for informational purposes only and should not be considered financial advice.